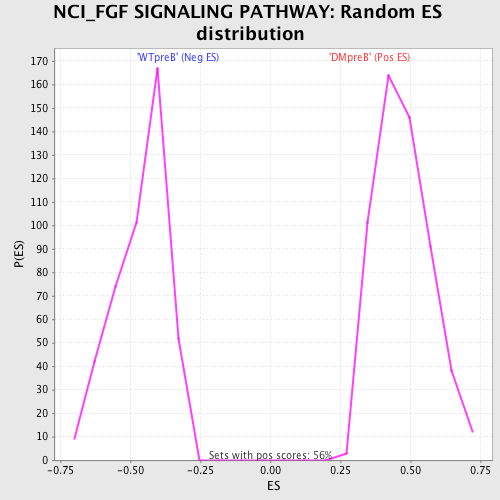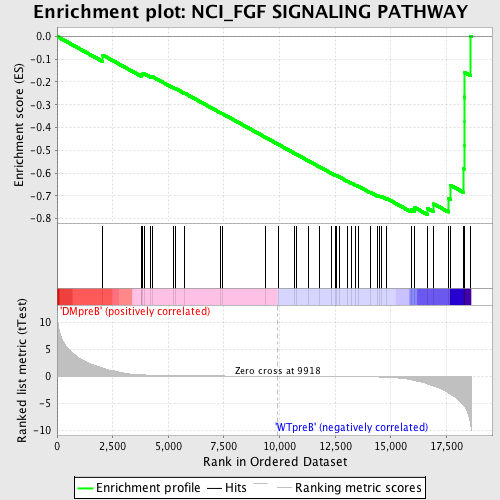
Profile of the Running ES Score & Positions of GeneSet Members on the Rank Ordered List
| Dataset | Set_04_DMpreB_versus_WTpreB.phenotype_DMpreB_versus_WTpreB.cls #DMpreB_versus_WTpreB |
| Phenotype | phenotype_DMpreB_versus_WTpreB.cls#DMpreB_versus_WTpreB |
| Upregulated in class | WTpreB |
| GeneSet | NCI_FGF SIGNALING PATHWAY |
| Enrichment Score (ES) | -0.7815565 |
| Normalized Enrichment Score (NES) | -1.7004899 |
| Nominal p-value | 0.0 |
| FDR q-value | 0.010331077 |
| FWER p-Value | 0.108 |
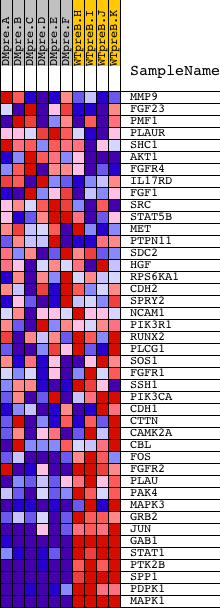
| PROBE | DESCRIPTION (from dataset) | GENE SYMBOL | GENE_TITLE | RANK IN GENE LIST | RANK METRIC SCORE | RUNNING ES | CORE ENRICHMENT | |
|---|---|---|---|---|---|---|---|---|
| 1 | MMP9 | 14732 | 2058 | 1.485 | -0.0824 | No | ||
| 2 | FGF23 | 17275 | 3779 | 0.255 | -0.1701 | No | ||
| 3 | PMF1 | 12452 | 3800 | 0.251 | -0.1664 | No | ||
| 4 | PLAUR | 18351 | 3858 | 0.239 | -0.1649 | No | ||
| 5 | SHC1 | 9813 9812 5430 | 3936 | 0.225 | -0.1647 | No | ||
| 6 | AKT1 | 8568 | 4218 | 0.183 | -0.1763 | No | ||
| 7 | FGFR4 | 3226 | 4290 | 0.174 | -0.1768 | No | ||
| 8 | IL17RD | 22069 | 5214 | 0.100 | -0.2246 | No | ||
| 9 | FGF1 | 1994 23447 | 5332 | 0.094 | -0.2291 | No | ||
| 10 | SRC | 5507 | 5727 | 0.076 | -0.2488 | No | ||
| 11 | STAT5B | 20222 | 7325 | 0.036 | -0.3341 | No | ||
| 12 | MET | 17520 | 7434 | 0.034 | -0.3393 | No | ||
| 13 | PTPN11 | 5326 16391 9660 | 9360 | 0.007 | -0.4428 | No | ||
| 14 | SDC2 | 9134 | 9961 | -0.001 | -0.4751 | No | ||
| 15 | HGF | 16916 | 10648 | -0.009 | -0.5118 | No | ||
| 16 | RPS6KA1 | 15725 | 10766 | -0.011 | -0.5179 | No | ||
| 17 | CDH2 | 1963 8727 8726 4508 | 11295 | -0.019 | -0.5460 | No | ||
| 18 | SPRY2 | 21725 | 11811 | -0.027 | -0.5732 | No | ||
| 19 | NCAM1 | 5149 | 12342 | -0.038 | -0.6010 | No | ||
| 20 | PIK3R1 | 3170 | 12502 | -0.041 | -0.6088 | No | ||
| 21 | RUNX2 | 4480 8700 | 12564 | -0.043 | -0.6113 | No | ||
| 22 | PLCG1 | 14753 | 12675 | -0.046 | -0.6163 | No | ||
| 23 | SOS1 | 5476 | 13046 | -0.056 | -0.6352 | No | ||
| 24 | FGFR1 | 3789 8968 | 13230 | -0.062 | -0.6438 | No | ||
| 25 | SSH1 | 10540 | 13433 | -0.070 | -0.6534 | No | ||
| 26 | PIK3CA | 9562 | 13540 | -0.075 | -0.6576 | No | ||
| 27 | CDH1 | 18479 | 14082 | -0.109 | -0.6847 | No | ||
| 28 | CTTN | 8817 4575 1035 8818 | 14418 | -0.143 | -0.7000 | No | ||
| 29 | CAMK2A | 2024 23541 1980 | 14506 | -0.152 | -0.7017 | No | ||
| 30 | CBL | 19154 | 14602 | -0.166 | -0.7037 | No | ||
| 31 | FOS | 21202 | 14800 | -0.201 | -0.7104 | No | ||
| 32 | FGFR2 | 1917 4722 1119 | 15914 | -0.650 | -0.7579 | Yes | ||
| 33 | PLAU | 22084 | 16082 | -0.801 | -0.7516 | Yes | ||
| 34 | PAK4 | 17909 | 16640 | -1.423 | -0.7543 | Yes | ||
| 35 | MAPK3 | 6458 11170 | 16931 | -1.809 | -0.7353 | Yes | ||
| 36 | GRB2 | 20149 | 17590 | -3.055 | -0.7122 | Yes | ||
| 37 | JUN | 15832 | 17687 | -3.335 | -0.6535 | Yes | ||
| 38 | GAB1 | 18828 | 18283 | -5.430 | -0.5816 | Yes | ||
| 39 | STAT1 | 3936 5524 | 18294 | -5.505 | -0.4768 | Yes | ||
| 40 | PTK2B | 21776 | 18298 | -5.513 | -0.3714 | Yes | ||
| 41 | SPP1 | 5501 | 18300 | -5.516 | -0.2658 | Yes | ||
| 42 | PDPK1 | 23097 | 18324 | -5.661 | -0.1586 | Yes | ||
| 43 | MAPK1 | 1642 11167 | 18592 | -9.104 | 0.0013 | Yes |